

Waist-to-Hip Ratio (WHR) Chart: Health Risks & Measurement Guide
Discover the WHO Waist-to-Hip Ratio health chart, clinical risk cutoffs, and why WHR predicts longevity far better than standard BMI.
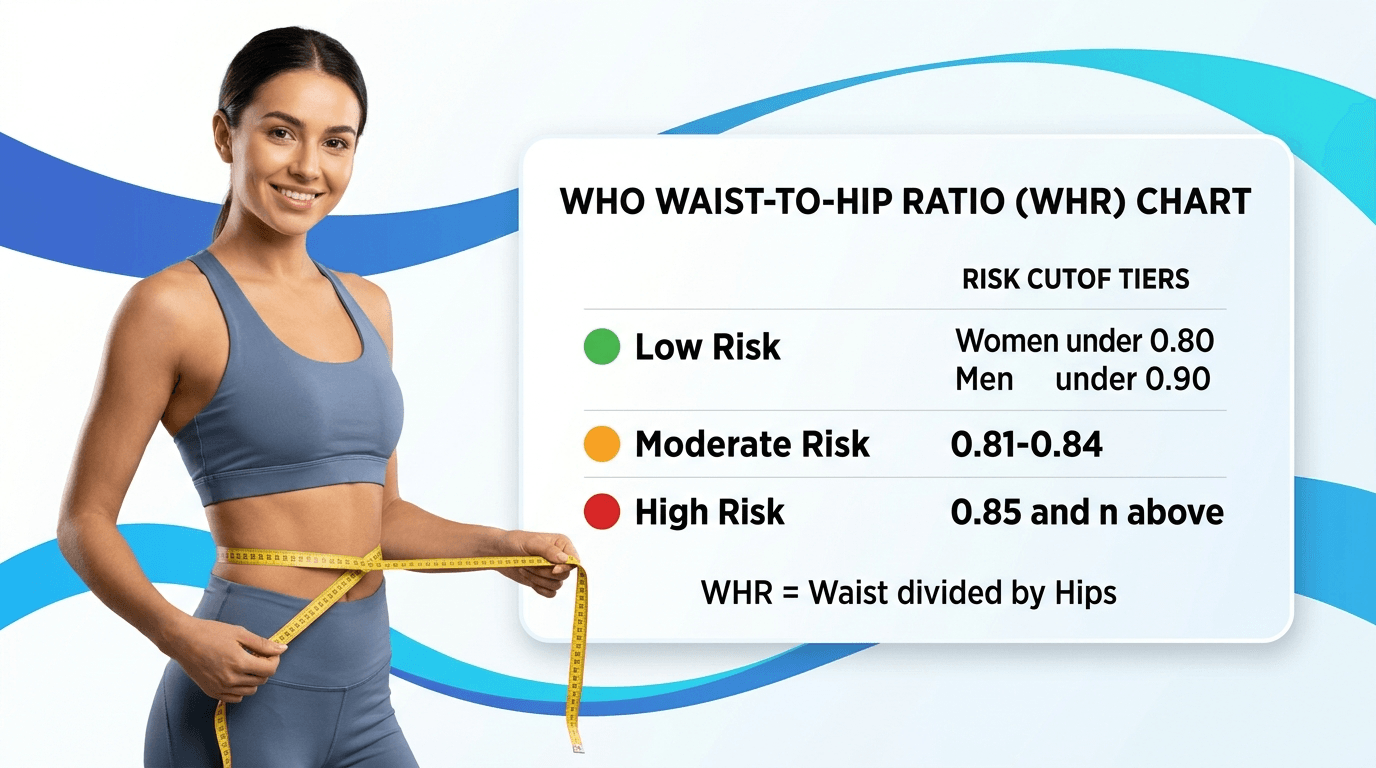
Derived from the World Health Organization (WHO) Expert Consultation on Waist Circumference and Waist-Hip Ratio. Demonstrates why central visceral adiposity measured by WHR is superior to Body Mass Index (BMI) for predicting type 2 diabetes, stroke, and cardiovascular mortality.
Waist-to-Hip Ratio (WHR) Health Chart: WHO Risk Tiers
Your Waist-to-Hip Ratio (WHR) evaluates how body fat is distributed across your central midsection compared to your hips and thighs. It is computed simply as your natural waist circumference divided by your widest hip circumference.
According to the World Health Organization (WHO), cardiometabolic risk is stratified into three clinical tiers:
| Risk Level | Women (WHO Standard) | Men (WHO Standard) | Clinical Interpretation |
|---|---|---|---|
| Low Risk | < 0.80 | < 0.90 | Optimal gynoid/neutral fat distribution; lowest risk of cardiovascular events. |
| Moderate Risk | 0.81 – 0.85 | 0.90 – 0.95 | Intermediate abdominal deposition; monitor metabolic biomarkers regularly. |
| High Risk | > 0.85 | > 0.95 | Substantial visceral adiposity; heightened risk of insulin resistance and heart disease. |
Calculate your exact WHR score in seconds using our interactive Body Shape & WHR Calculator.
Why Waist-to-Hip Ratio Is Superior to BMI for Longevity
Body Mass Index (BMI) only measures total weight relative to height, remaining blind to tissue composition and regional distribution:
- Visceral Fat Toxicity: Deep abdominal (visceral) fat surrounding the liver and pancreas secretes free fatty acids and inflammatory cytokines directly into the portal circulation, accelerating atherogenesis.
- Subcutaneous Protection: Gluteofemoral (hip and thigh) fat acts as a metabolic sponge, clearing circulating lipids and releasing the protective hormone adiponectin.
- Normal Weight Obesity (TOFI): Individuals who are “thin on the outside, fat on the inside” may possess a “normal” BMI of 22 yet have a dangerous WHR of 0.88, exposing them to hidden metabolic disease.
Case Study: BMI Paradox vs. WHR Reality
Height: 5′6″ | Weight: 165 lbs | Waist 28″ | Hips 41″
- • BMI: 26.6 (Clinically flagged as “Overweight”)
- • WHR Calculation: 28 / 41 = 0.683
- • WHO Risk Tier: Low Risk (Under 0.80 cutoff)
- • Metabolic Reality: Highly athletic gynoid profile with robust insulin sensitivity.
Height: 5′6″ | Weight: 135 lbs | Waist 32″ | Hips 35″
- • BMI: 21.8 (Clinically categorized as “Normal / Healthy”)
- • WHR Calculation: 32 / 35 = 0.914
- • WHO Risk Tier: High Risk (Significantly above 0.85 cutoff)
- • Metabolic Reality: Sarcopenic visceral adiposity with elevated cardiometabolic vulnerability.
How to Measure Waist and Hips with WHO Precision
1. Measuring Natural Waist
Locate the midpoint between the bottom of your lowest palpable rib and the top of your iliac crest (hip bone). Measure at the end of a normal exhalation with the tape snug but not compressing the skin.
2. Measuring Maximum Hips
Stand with feet together. Wrap the tape horizontally around the maximum circumference of your buttocks and greater trochanters. Keep the tape parallel to the floor all the way around.
Calculate Your WHR Score in Seconds
Input your waist and hip measurements into our clinical calculator to check your WHO risk tier and proportion score instantly.
Educational Disclaimer: ToolWingz provides WHO waist-to-hip benchmarks for educational and health awareness.